Global Forecast System
1. Atmosphere
Air pressure above sea level is calculated as
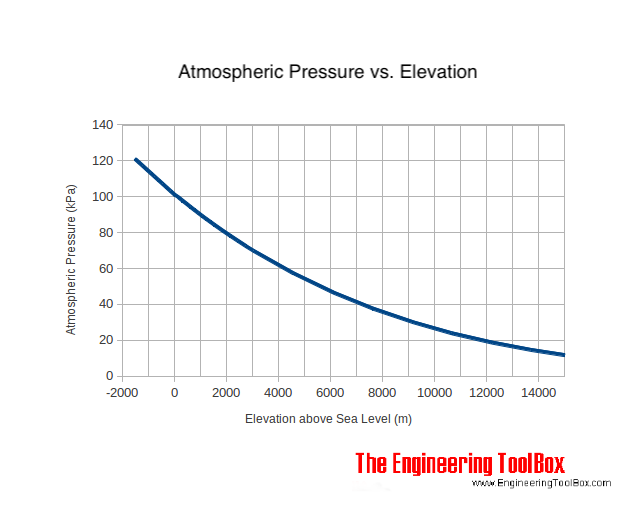
| Height (ft) | Height (m) | Pressure (psia) | Pressure (hPa) | Air density (kg/m3) |
|---|---|---|---|---|
0 |
0 |
14.696 |
1013.3 |
1.225 |
10,000 |
3,048 |
10.108 |
697.0 |
0.905 |
20,000 |
6,096 |
6.759 |
466.0 |
0.653 |
30,000 |
9,144 |
4.373 |
301.0 |
0.459 |
40,000 |
12,192 |
2.730 |
188.0 |
0.303 |
50,000 |
15,240 |
1.692 |
117.0 |
0.188 |
60,000 |
18,288 |
1.049 |
72.3 |
0.116 |
70,000 |
21,336 |
0.651 |
44.9 |
0.072 |
80,000 |
24,384 |
0.406 |
28.0 |
0.044 |
90,000 |
27,432 |
0.255 |
17.6 |
0.027 |
100,000 |
30,480 |
0.162 |
11.2 |
0.017 |
110,000 |
33,528 |
0.100 |
6.92 |
0.011 |
2. Forecasts
|
Upper-level wind forecast
Select |
The first number is the pressure level in millibars / hectopascals, and wnd_ht means:
wind + geopotential height at that pressure surface.
These are constant-pressure surfaces, not fixed geometric altitudes above the ground!
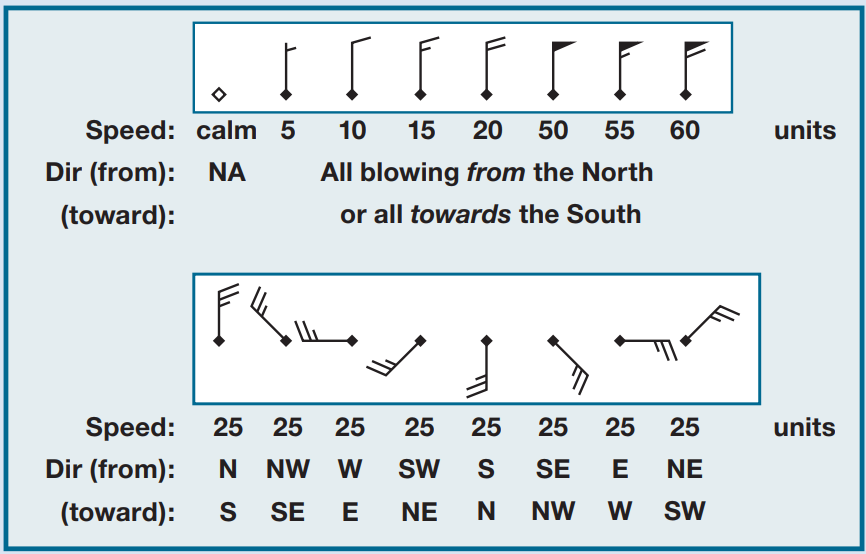
Wind is shown with wind barbs.
Height is shown as contours of geopotential height in decameters (110 → 11.0 km).
[ [ Draw a side view of the pressure contour. ] ]
Think of these as “winds at pressure layers” rather than “winds at exact altitudes.” A high-altitude balloon rising through the troposphere would roughly pass through:
925 → 850 → 700 → 500 → 300 → 250 → 200 hPa